
Charging batteries, food for minds [The Battery Cycle #4 | 2026 RELEASE]
![Charging batteries, food for minds [The Battery Cycle #4 | 2026 RELEASE]](https://api.ev-route.com/storage/news/2026-09/charging-batteries-food-for-minds-the-battery-cy-1.webp)
Five years ago, with insights from Claudius Jehle, CEO of volytica diagnostics GmbH, we launched “The Battery Cycle” series of articles, aiming to shedding light on the complexities of Li-Ion batteries.
The series provided a huge amount of valuable insights for anyone involved in electric mobility.
Now, five years later, we return to those same topics – still thanks to the collaboration with Claudius Jehle – enriched by real-world data and lessons learned.
The full series of articles, freshly updated, is also published in a monographic special feature accompanying Sustainable Bus (and sister platform Sustainable Truck & Van and Powertrain International) issues throughout 2026.
We welcome your questions, feedback and contributions at info@sustainable-bus.com.
Picturing batteries like bulbous wine decanters filled with foamy beer, as we did in the previous article about State of Charge, greatly helps to understand everyday problems with SoC estimation, balancing problems and sudden standstills. But this analogy also greatly helps to understand typical questions around charging of batteries, which we will address in this article.
It’ll be the place where to explain – among many other things – how and why doubling charging power cannot cut charging time half, at least if one intends to charge until full.
Let’s start with depot charging setups, i.e. with buses or trucks with rather large batteries (>300 kWh) that are meant to serve a route all day with no or only few top-up charges. Typically, one wants the battery to be at 100% in the morning and to end with some reserve at the end of the day.
Is depot charging a wise choice?
But charging a battery to 100% before the day starts is not as straightforward as one might think. The charger first ‘negotiates’ the upcoming charging process with the vehicle via some sort of dedicated communication protocol, involving an agreement on – first and foremost – the planned charging power that the charger is able to give, but also that the battery is capable of receiving. We limit ourselves to the battery part here, because one could write endless articles on this delicate and fragile communication part. In particular, we are explaining the situation for well-sized and not super-oversized batteries; for oversized batteries, the below explained CV-part typically does not affect charging so much.
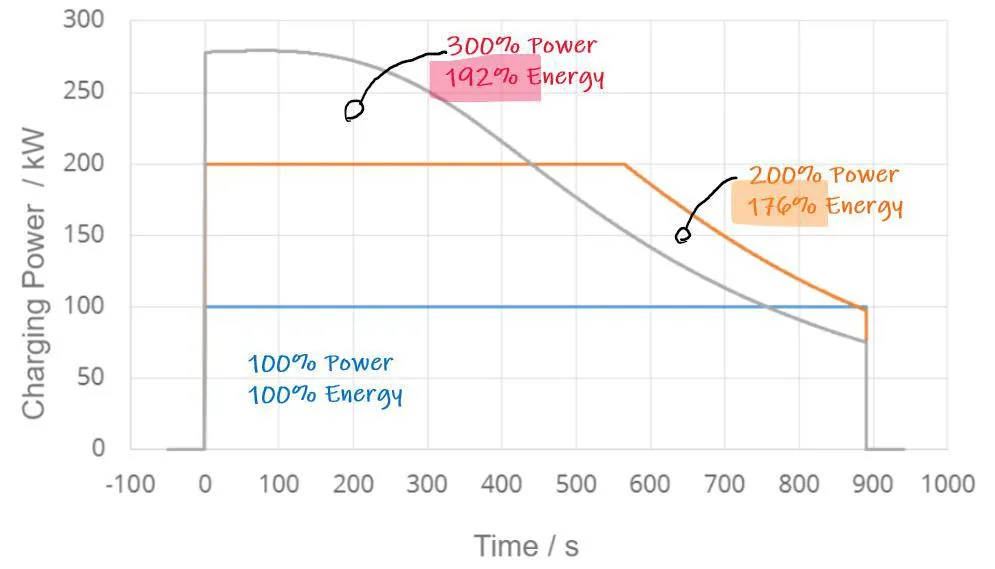
agreed current in a constant flow – this phase is thus called constant current phase or simply CC phase (see graph on the right). In the beer analogy, the glass constantly fills up, and the filling height increases; both the beer rises, and foam starts building – electrochemically speaking, ‘overpotentials’ on the measurable voltage start building up (if you read the other articles before: this is due to the migration of the bulky ions into the electrodes taking some effort, if you will, and this is macroscopically visible as reversible voltage build up, slowly vanishing again after charging stops, just like foam on beer…).
Once the total filling height, i.e. beer plus foam, approaches the rim of the glass, i.e. the battery voltage reaches the absolute maximum admissible voltage, charger and battery quickly start renegotiating a new, smoothly changing current profile that keeps the total filling height just constant at the top – the constant voltage or CV phase. What in essence happens is that stepwise reducing the current will let the foamy part decrease, while the liquid part can continue to rise. This process in total is often called ‘CCCV charging‘.
Assume you would just stop charging when the voltage first hits the top – foam would settle and, somewhat surprisingly, you would find your glass only 85% full after some 10 to 30 minutes. So it is exactly like drafting a beer: CC beer flow until the foam hits the rim, then reduction of beer flow, keeping the total height constant (CV), only changing the liquid-to-foam ratio.
Getting to know the implications…
What are the implications? Look at the simulation results in the diagram – one straightforward consequence is that doubling charging power cannot cut charging time half, at least if one intends to charge full. As a matter of fact, the CC part is sped up, but also not by the factor 2, as the foam rises much faster, so the CV part becomes even more pronounced. In the example, there is even no CV part reached after ~900s (it would come later), but by doubling the power, CV is reached after ~570s, reducing the energy intake by 24%. Tripling the power obviously brings the system into CV right away (no CC observable), resulting in a less than double energy intake! Needless to say, this is just an example and might not be applicable to your specific assets.
Oversized batteries – and this is very true for LFP-based assets – don’t show this effect as pronounced as explained here (as the CV-part might not even be reached, i.e. you are drafting ca. 1 liter of beer into a 1.5 liter glass: you will hardly produce enough foam to hit the rim).
Learning? 3x charging power doesn’t necessarily reduce charging time by 3!
It can easily be that the CV part takes just as long as the CC part. To get the first 80% in can take just as long as to get the last 20% in! Observe it in your monitoring systems: first, SoC rises linearly, then it slowly decreases until it rests at 100%.
Overhead catenary charging (like in trolley buses or some e-truck application ideas) deserves also a mention: next to the obvious infrastructural challenges of maintaining a catenary network, a real challenge lies in the electrical setup of the vehicles: most road vehicles have rubber tires. They don’t conduct electrical current. Hence rubber-tire vehicles with catenary need two overhead wires (adding to the infrastructure complexity vs. metal-tire trains). The real ‘but’ however is safety: In a metal wheel-setup, an electric fault (such as: a live wire touching the vehicle frame and setting it under high voltage) would be immediately diverted to the ground via the wheels; the danger of metal frames or vehicle body being ‘under voltage’ is very low. But in rubber tire assets, an electric fault might set the whole vehicle under voltage, and a passenger touching the body might get an electric shock. The result is that the electrical setup of such vehicles adds complexity and costs, making it more challenging economically.
If you cannot observe this in your data when approaching 100%, the very likely reason is that the SoC that you see is not the actual, the ‘real’ SoC. OEMs and manufacturers distinguish between the SoC that is communicated (often ‘operational SoC’) and the ‘real’, internally calculated one (‘technical SoC’), which is obviously particularly relevant for oversized batteries where the usable, operational net capacity differs significantly from the technically available capacity.
The operational SoC is adapted to e.g. show 100% when the real is only at ~90%. Without going too much into detail, there are good reasons to do this: (a) to have some reserves (to accommodate the known estimation errors, cf. the last article), (b) to save the battery (too high/low SoCs are often detrimental to health) and (c) to emulate a seemingly uniform behavior over the whole lifetime by unlocking the reserves over the lifetime. So, looking at (c), if you do not observe this charging behavior now, you might well observe it later – bear in mind that the depot charging time of the vehicle might increase in the future!
Hands-on tips: Don’t just request access to battery data, ask for the right signals in the right resolution. Parameters like SoC, SoH, current, voltage, and temperature should be logged at high enough frequency to reflect real charging behavior.
What about opportunity charging?
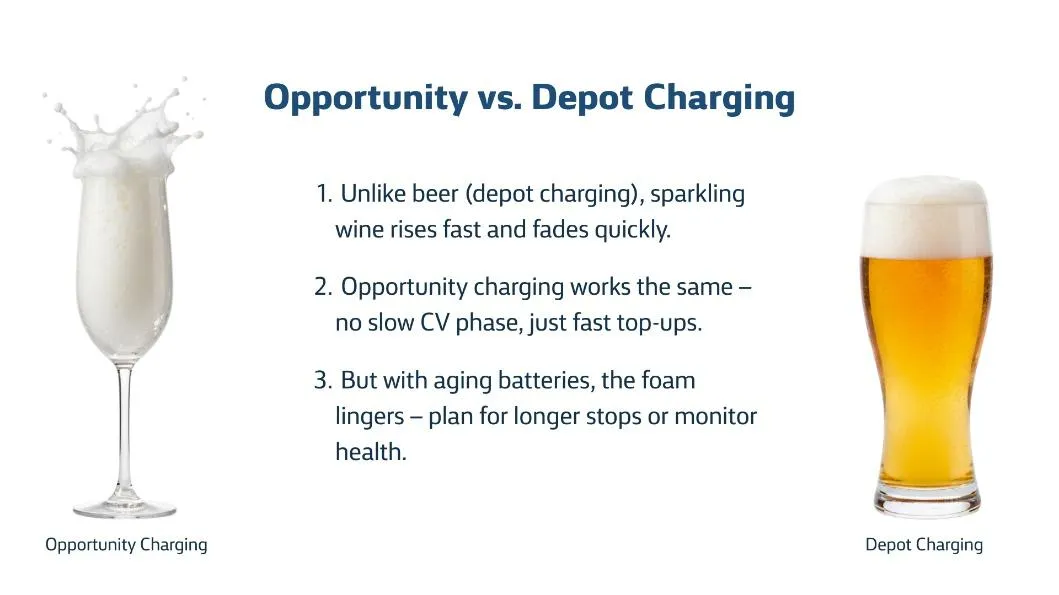
With opportunity charging along the route, there are other challenges. One typically does not charge to 100% (only in the morning, as above) but repeatedly top up a smaller battery (<200 kWh). The foam hardly hits the rim, so no tenacious CV phase, only CC. More like topping up a glass of water, or red wine, now and then. For speedy charging interruptions, the power is typically quite high. So although there is no CV part that could ‘choke’ the fast charging, the high pulses can result in resistance-induced voltage spikes (here the glass & liquid analogy fails a bit – maybe think of sparkling wine: you pour it in, the foam extremely quickly rises very high and decays in virtually only seconds). As the resistance increases due to degradation, these spikes increase likewise. Take-away message: opportunity charging has beneficial characteristics, at least charging timewise, but can suffer from degradation induced charging time increases.
Finally: inductive charging…
One remark on inductive charging, where the physical plugging for a galvanic connection is replaced by wireless over-the-air energy transmission. It’s a fabulous idea, as there would be virtually not positioning and manual handling efforts anymore. One could even charge while driving. But physics kick in: The ratio of energy that reaches the vehicle vs. what is lost due to peculiar induction inefficiencies – plainly: that is converted into heating the environment – chiefly depends on (a) the distance between the receiver and the sender and (b) the frequency of the alternating electro-magnetic induction field.
For inductive charging not to become uneconomically unbearable, you either have to (a) reduce the distance between sender/receiver to only millimeters and/or (b) increase the frequency and thus coil size and thus weight. Ideally, a (several hundred kilograms!) copper coil should be located millimeters away from the sender. This proved, and proves, to be technologically so challenging that until today, no economically viable and scalable solution was found, and and close to 100% of all batteries are charged with direct connections.
At the end, we encourage everybody to openly discuss the options and implications of different charging philosophies with their OEM partners. It is very helpful to ask for maximum transparency in the basic battery & charger signals and even for periodic information about the degradation, as we already now learned now how degradation affects every aspect of a battery.
At a glance
Li ion batteries exhibit a curious effect: the amount of energy chargeable in a certain time depends on the charging power, e.g. doubling charging power does not necessarily cut the charging time in half.
The SoC you see (“operational/ net SoC”) is most often not the real SoC, for good reason.
In depot charging applications or anywhere, where a battery is charged to 100% (really 100%), and where the battery is not heavily oversized, some form of CCCV charging is employed.
The peculiar pattern of CCCV leads to the that behavior that doubling or tripling charging power does not cut the time half or by a third.
Opportunity charging is mostly CC, so it is not susceptible to this pattern, but is susceptible to rising resistances due to
* i.e. OCV characteristics, see article #3
** i.e. the overpotential/dynamic voltages
*** Simulation (LFP, SOC0=50%, 30°C env) results from: Bunzel, A.; Morawietz, L.; Ufert, M.: Technologische und ökonomische Bewertung der Elektrifizierung von ÖPNV-Busflotten im Werkstatt- und Betriebshofbereich. Fachtagung „Werkstatt- und Betriebshofkonzepte für Elektrobusse“, Dresden, 11.-12.10.2018.
The post Charging batteries, food for minds [The Battery Cycle #4 | 2026 RELEASE] appeared first on Sustainable Bus.