
Trucks, vans, buses: electric vehicles are gaining momentum in Europe, but diesel persists
According to figures released by the Association of European Automobile Manufacturers (ACEA), registrations of electric trucks, vans, and buses all saw strong growth between January and September 2026. But except for buses, diesel still accounts for the vast majority...
Electric vehicles are gaining ground in all segments of commercial vehicles in Europe. In the first nine months of 2026, registrations of electric trucks surged by 49.8%, those of vans by 38.2%, and those of buses by 37.6%. However, their share of the market remains highly uneven: electric vehicles make up 26.4% of new buses and 14.1% of vans, but only 5.3% of trucks, where diesel still holds an overwhelming 91.7% share
What’s even more surprising is that diesel truck registrations also increased, rising by 6.6% in the first nine months of 2026. In other words, electric trucks are growing rapidly, but this growth has not yet led to a decline in diesel truck sales. Both types of trucks saw an increase in registrations in what is otherwise a more dynamic market.
Also read
Electric trucks: Global sales surged by 75% in just six months
Germany, France, Netherlands: Three countries account for most electric trucks
In total, 245,079 new trucks, including 12,873 electric ones, were registered in the European Union from January to September 2026, representing a 7.5% increase year-on-year.
The advancement of electric vehicles is far from uniform across the continent. Three countries play a particularly important role in this trend: Germany, France, and the Netherlands.
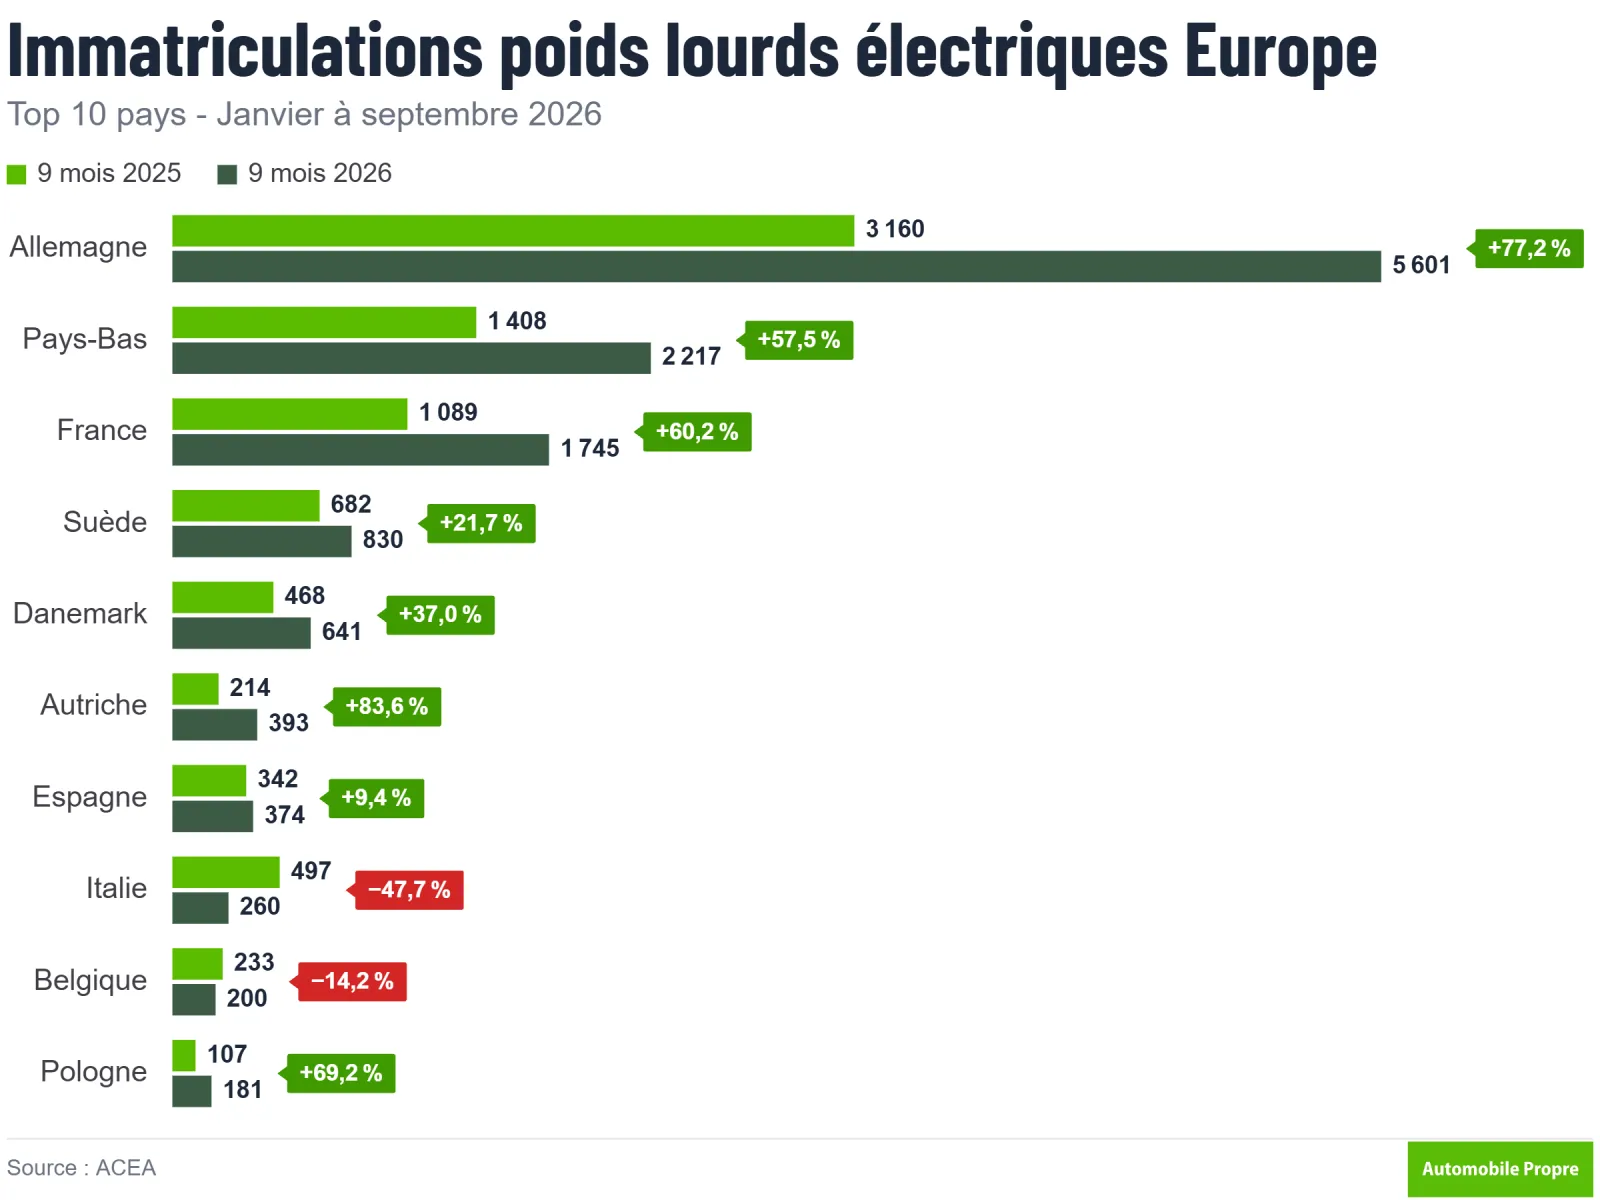
In Germany, registrations of rechargeable electric trucks surged by 77.2% in the first nine months of the year. France also saw strong growth at 60.2%, while the Netherlands recorded a rise of 57.5%.
Together, these three countries account for 74% of all registrations of rechargeable electric trucks in the European Union.
In detail, Germany holds a significant lead with 5,601 registered electric trucks, accounting for 43.5% of the total in Europe. Its growth is driven by trucks weighing 16 tonnes and more, whose numbers nearly doubled (+91.3%, to 1,722 units), while trucks weighing between 3.5 and 16 tonnes saw a 71.6% increase (3,879 units).
In France, the trend is reversed: trucks weighing between 3.5 and 16 tonnes surged by 86.6% (974 units), whereas heavier trucks increased by 36% (771 units). The Netherlands, on the other hand, has 1,195 medium-weight trucks (+40.3%) and 1,022 heavy trucks (+83.8%).
The Netherlands and Scandinavia lead, Italy is in freefall
When adjusted for the size of each market, the Netherlands and Nordic countries are leading the way. One in five new trucks registered in the Netherlands is now electric (20.2%), ahead of Sweden (18.4%) and Denmark (16.5%). Despite their larger markets, Germany (9.5%) and France (5.3%) remain far behind.
At the other end of the ranking, several major markets are showing a decline. Italy’s registrations of electric trucks dropped by 47.7% to 260 units, accounting for only 1.2%. Spain (1.6%) and Poland (0.7%) also remain below 2%, even though they are the third and fourth largest truck markets in the European Union.
Outside the European Union, the United Kingdom registered 3,246 electric trucks (+46.9%), accounting for 7.8% of its market. Switzerland (27.4%) and Norway (23.6%) have some of the highest electrification rates in Europe.
Electric Trucks: Top 10 Sales in Europe – January to September 2026
Country
9 months 2025
9 months 2026
Trend
Share of electric trucks
Germany
3,160
5,601
+77.2%
9.5%
Netherlands
1,408
2,217
+57.5%
20.2%
France
1,089
1,745
+60.2%
5.3%
Sweden
682
830
+21.7%
18.4%
Denmark
468
641
+37.0%
16.5%
Austria
214
393
+83.6%
7.3%
Spain
342
374
+9.4%
1.6%
Italy
497
260
-47.7 %
1.2 %
Belgium
233
200
-14.2 %
3.1 %
Poland
107
181
+69.2 %
0.7 %
Total EU
8,591
12,873
+49.8 %
5.3 %
Electric vans are also growing, but diesel still dominates
The situation is slightly different in the light commercial vehicle market. Between January and September 2026, 1,073,427 new vans were registered in the European Union, a volume that remained generally stable compared to the same period in 2025.
Electric light commercial vehicles, however, saw a 38.2% increase, raising their market share to 14.1%, up from 10.2% a year earlier.
Also read
Electric vans: Without the EU superbonus, Maxus prepares its counteroffensive
Diesel remains the preferred engine for professional buyers as well, with 838,830 registrations and a market share of 78.1%. This figure is down from 81.7% recorded in the first nine months of 2025.
Registrations of diesel pickup trucks declined by 4.3%, while gasoline models dropped by 19.8%, accounting for only 3.7% of the market. Hybrid vans saw a 35.6% increase, but their market share remains limited to 3.4%.
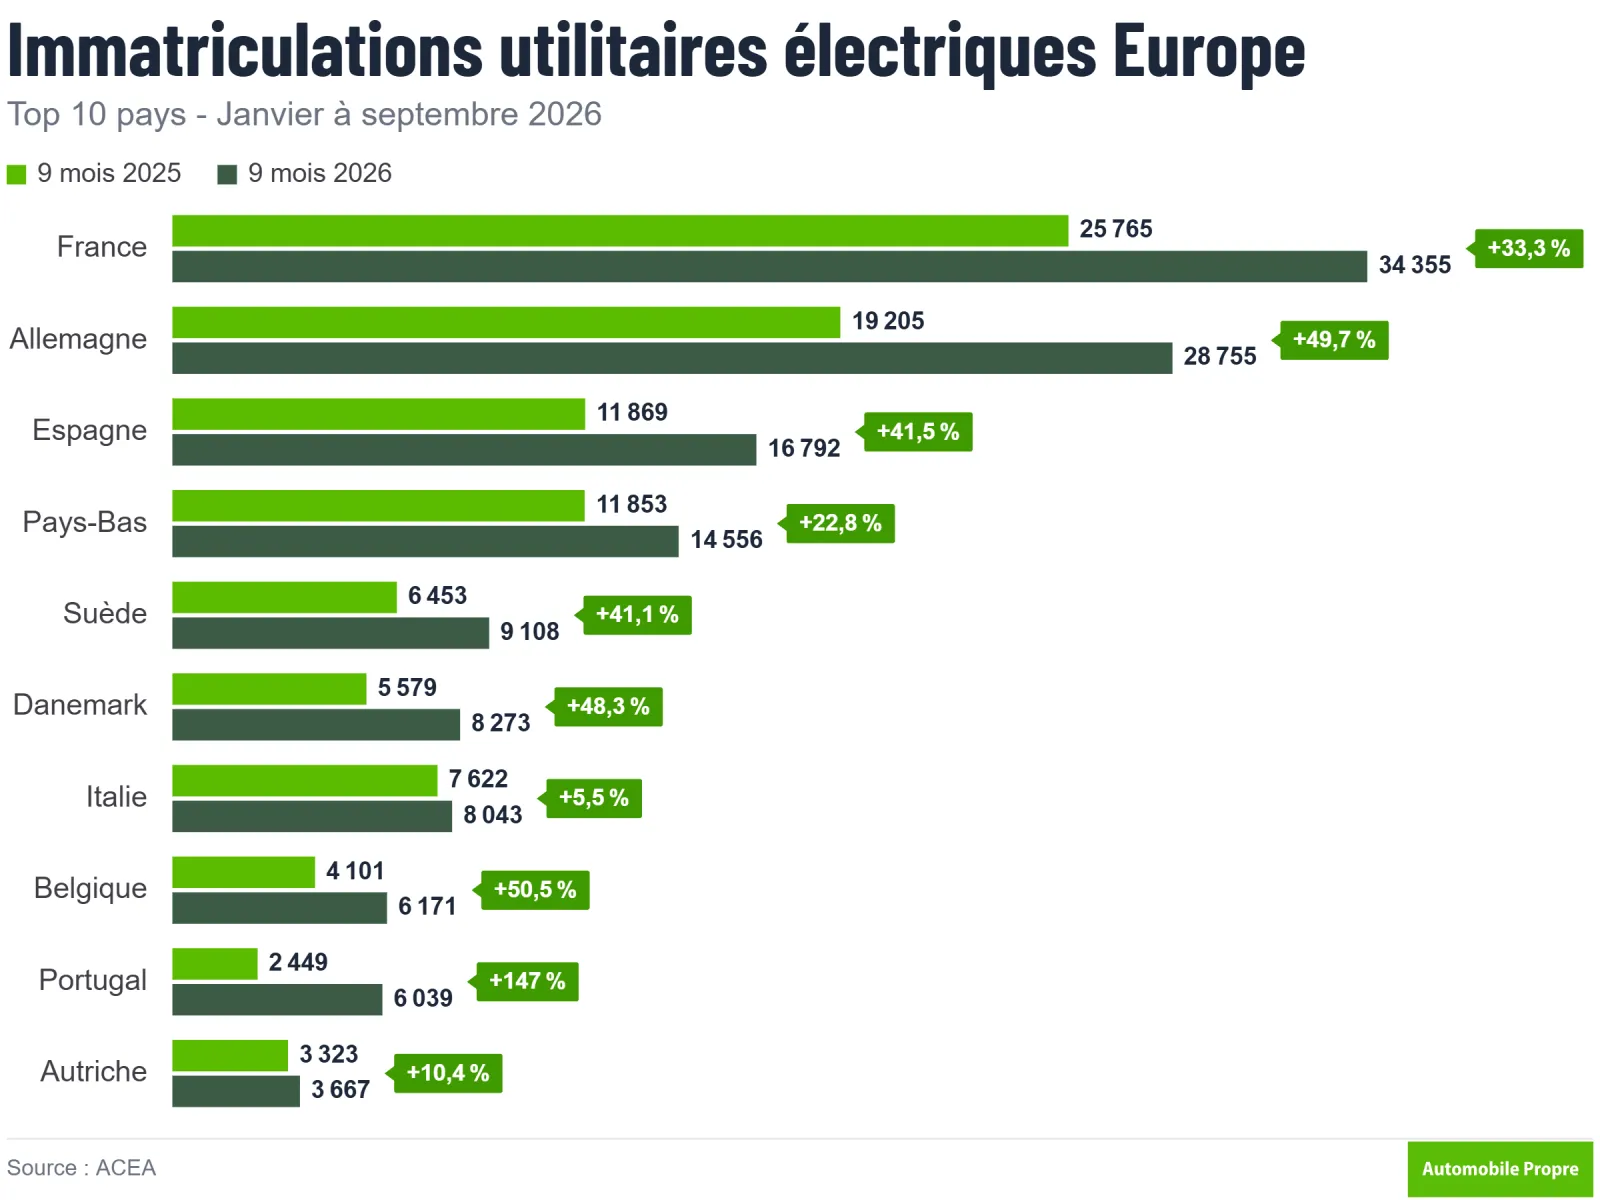
In terms of electric vehicles, France remains the largest European market, with 34,355 units registered in the first nine months, representing a 33.3% increase. It accounts for 22.6% of total EU sales, while the share of electric vehicles in this market rose from 9.7% to 13.8%, despite a 5.6% decline in France’s overall commercial vehicle market. Germany follows with 28,755 units (a 49.7% increase, accounting for 15.2% of the market), ahead of Spain (16,792 units, a 41.5% increase).
In terms of penetration rates, the Netherlands and Denmark stand out as leaders. According to ACEA, 84.3% of new commercial vehicles registered in the Netherlands are electric, while Denmark reaches 43.7%, up from 29.7% a year earlier. Sweden (32.1%) and Portugal (24.0%), where sales more than doubled (+146.6%), complete the expanded top tier. In contrast, Italy lags behind with only a 6.0% share.
Electric Commercial Vehicles: Europe’s Top 10 Sales – January to September 2026
Country
9 months 2025
9 months 2026
Change
Electric vehicle share
France
25,765
34,355
+33.3%
13.8%
Germany
19,205
28,755
+49.7%
15.2%
Spain
11,869
16,792
+41.5%
11.4%
Netherlands
11,853
14,556
+22.8 %
84.3 %
Sweden
6,453
9,108
+41.1 %
32.1 %
Denmark
5,579
8,273
+48.3 %
43.7 %
Italy
7,622
8,043
+5.5 %
6.0 %
Belgium
4,101
6,171
+50.5 %
11.7 %
Portugal
2,449
6,039
+146.6 %
24.0 %
Austria
3,323
3,667
+10.4 %
13.3 %
Total EU
109,790
151,691
+38.2 %
14.1 %
Electric buses are advancing faster
The bus market is ultimately where electrification is most advanced in terms of market share.
The registration of rechargeable electric buses increased by 37.6% in the European Union during the first nine months of 2026. Their market share now stands at 26.4%, up from 22.1% a year earlier.
Diesel still dominates with 58.4% of the market, but its dominance is significantly weaker than in the truck and light commercial vehicle sectors. Hybrid electric buses also saw a 24% increase, accounting for 6.9% of new registrations. Overall, the European bus market grew by 15.2%, with 32,695 new vehicles registered between January and September 2026.
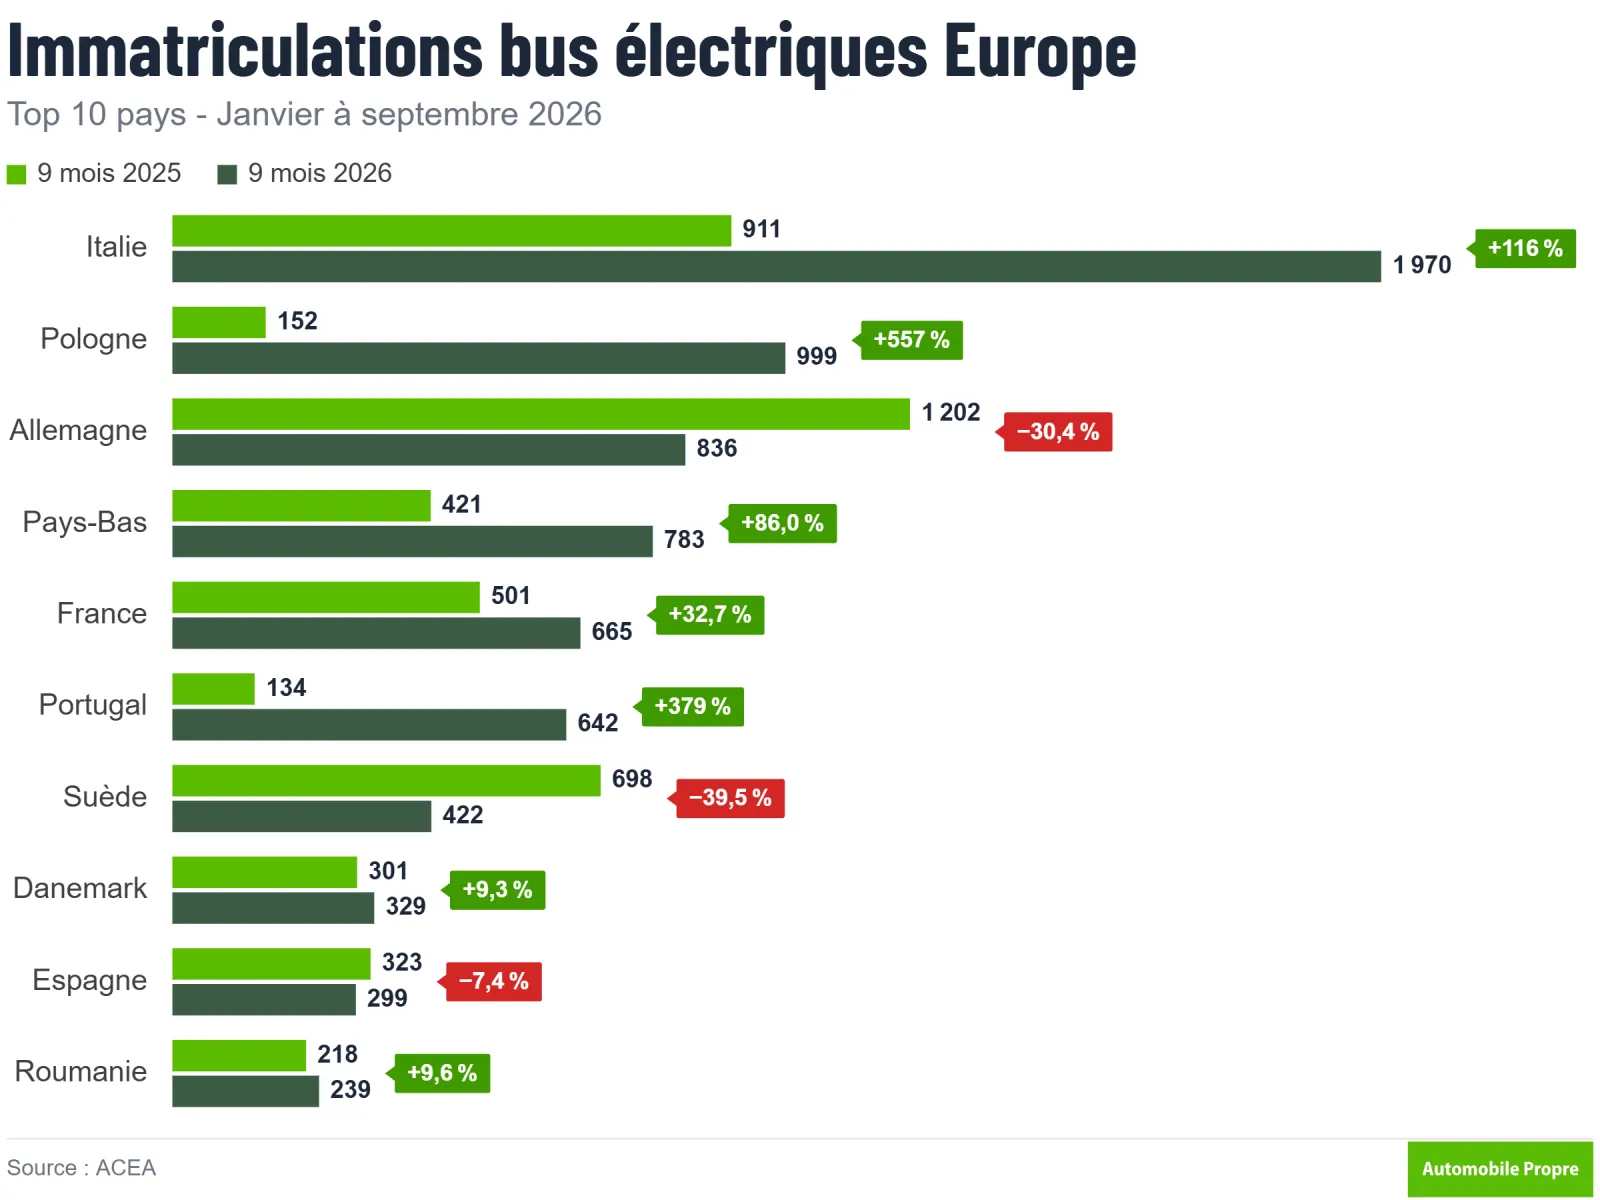
Italy, now the largest European market for buses, drives much of this growth: its registrations of electric buses more than doubled (+116.2%), reaching 1,970 units, accounting for 22.8% of the total in the European Union. The share of electric buses there rose to 36.9%, up from 22.9% a year earlier. Poland also saw remarkable progress, with 999 electric buses registered compared to 152 a year prior (+557.2%), bringing their share to 32.2%. France experienced more modest growth (+32.7%, to 665 units), with electric buses accounting for only 12.6% of new buses there.
Among the major markets, Germany stands out as an exception: its registrations of electric buses dropped by 30.4% to 836 units, with their share falling from 25.2% to 15.9%, while its bus market grew by 10.1%. Sweden (-39.5%) and especially Belgium (-71.4%) also experienced significant declines. In terms of penetration rates, smaller markets lead the way: Romania (81.8%), the Netherlands (74.9%), Denmark (64.0%), and Portugal (55.0%) all exceed 50%.
Electric Buses: Europe’s Top 10 Sales – January to September 2026
Country
9 months 2025
9 months 2026
Change
Share of electric buses
Italy
911
1,970
+116.2%
36.9%
Poland
152
999
+557.2%
32.2%
Germany
1,202
836
-30.4%
15.9 %
Netherlands
421
783
+86.0 %
74.9 %
France
501
665
+32.7 %
12.6 %
Portugal
134
642
+379.1 %
55.0 %
Sweden
698
422
-39.5 %
50.9 %
Denmark
301
329
+9.3 %
64.0 %
Spain
323
299
-7.4 %
10.1 %
Romania
218
239
+9.6 %
81.8 %
Total EU
6,276
8,633
+37.6 %
26.4 %